EBird species and checklist counts adjusted for population
I have posted before about the eBird Big Day. The dust has now settled and the results by country are available. I thought it would be interesting to see how the results appeared when looked at when adjusted for the population of each country.
The first challenge for a bear of little brain such as me was to get the results for each country. After an email from me a quite prompt and friendly (probably more friendly than I deserved) email from eBird pointed out that it was already available - they gave a link but there is also one lurking on the webpage (Click on 'World" then scroll down until "All countries" eventually appears, and bingo).
A quick copy and paste into Excel, remove the histograms and upload to ACCESS. (By fiddling with the date I also got a full eBird list x country, which will also feature below.) So that was half the data I needed.
The other half of the data is the population. This involves the work of demographers so, like taxonomy, there are a squillionn possible measures of population each of which will be regarded by its author and a few disciples as the only worthwhile one. From my time working in the UN I like the series put out by the United Nations Population Division best. They have final estimates for 2010 and projections for years since then. Although the 2010 estimates are 5 years old they are largely factual and not subject to the choices (eg about fertility rates) inherent in projections so have mainly used them rather than more up to date ones from alternate sources.
Well that was easy, wasn't it. Now we get to the tricky bit, which is matching the names of countries between two independent datasets. There are many possible reasons for the differences between the names used including:
It would be nuts to try to present tables or graphs covering all or any of these in the presentations which follow so in each chart I will just show the top 20 entries. The simple stuff (eg countries x number of Big Day species and # of checklists submitted) are available from the eBird website so I won't bother with them.
The first analysis is the number of species recorded in the Big Day divided by the population. To get numbers that are easy to comprehend I have used population in millions. I have shown a graph, rather than numbers, as it is sufficient for the use. (NB: click on any of these graphics to see a larger version.)
 In each case these are countries in which modest number of species were seen but with small (or tiny) populations, giving a high ratio. Filtering the results by setting a qualification of "reporting at least 100 species" or "Population at least 100k" still showed a preponderance of countries with smaller populations kicking butt. Well done those small countries!
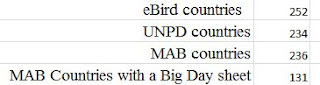
The major difference arose when a filter of "submitted at least 100 Big Day sheets" was applied. This cut down the list from 131 to 20 countries!
 Of the top 6 countries in this analysis, 5 are from Central or South America, with Zimbabwe a stand-out from Africa, A further 5 countries from Latn America are also included in this 20 top suppliers of sheets. I am tempted to also put in a comment about this possibly reflecting the importance of eco-tourism in the areas inspiring the population to have a red hot go at a Big Day project. (I'm not sure quite how important tourism is to thse countries, but in Tanzania a statement in the Parliament said " ... the tourism sector in the country is now contributing 17 per cent of GDP and generating 25 per cent of foreign exchange.") Again, well done the enthusiastic birders.
(As an aside, while Tanzania hasn't featured too greatly in my results the 21 sheets from that country scored 320 species - somewhat over 1/3rd of those ever recorded. Given that there are few indigenous birders and the tourist industry is not at peak in May that is probably a pretty fair wazungu effort.)
As well as this information about the Big Day the eBird site can also provide information about the number of species ever reported and the number of checklists ever submitted. (This will include lists submitted by folk loading up their life lists, including lists compiled before the Internet was invented, let alone eBird.)
Here are the top 20 countries in terms of the number of species ever reported to eBird.
 When looking at the next analysis I was surprised that Europe doesn't really feature at all in this list. I suspect that this may be a language issue inhibiting eBird's penetration to countries such as France and Germany as I was very surprised to see that their number of species ever reported are so much lower than that of the UK (which is in total about the land area of an Australian Municipality).
My next analysis is the proportion of species ever recorded which were entered in the Big Day.
 Again Latin America has done brilliantly.
I will also give particular praise to Sri Lanka as I recall from our visit to that lovely country that most of their migrant species have shot through (Australian for 'gone away' rather than implying they have been killed - this isn't Malta) by May. Possibly it reflects the small size of the country, and the fact that the expert guides know exactly where to go to bag a lot of species in a short time.
The countries which supply a lot of eBird sheets every month (USA, Canada and Australia) are also pretty well up this list.
Apart from Zimbabwe - those folk really did a good job - the Dark Continent seems to have underperformed, especially noting the appearance of several sub-Saharan countries in the top 20 list for # species ever seen. Presumably everyone in China is too busy making stuff to sell to the rest of us to go birding for the day (or they couldn't see birds through the smog).
I am sure there is lots more could be done with these data and I may have another go later.
The first challenge for a bear of little brain such as me was to get the results for each country. After an email from me a quite prompt and friendly (probably more friendly than I deserved) email from eBird pointed out that it was already available - they gave a link but there is also one lurking on the webpage (Click on 'World" then scroll down until "All countries" eventually appears, and bingo).
A quick copy and paste into Excel, remove the histograms and upload to ACCESS. (By fiddling with the date I also got a full eBird list x country, which will also feature below.) So that was half the data I needed.
The other half of the data is the population. This involves the work of demographers so, like taxonomy, there are a squillionn possible measures of population each of which will be regarded by its author and a few disciples as the only worthwhile one. From my time working in the UN I like the series put out by the United Nations Population Division best. They have final estimates for 2010 and projections for years since then. Although the 2010 estimates are 5 years old they are largely factual and not subject to the choices (eg about fertility rates) inherent in projections so have mainly used them rather than more up to date ones from alternate sources.
Well that was easy, wasn't it. Now we get to the tricky bit, which is matching the names of countries between two independent datasets. There are many possible reasons for the differences between the names used including:
- Some places beloved of birders (eg Antarctica, Svalbard) don't have a resident population);
- Others aren't countries under any definition ('High Seas' being a good example);
- Spelling differences (eg Faroe Islands vs Faeroe Islands)
- Official names which have to be used by UNPD are sometimes unduly complicated (Bolivia (Plurinational State of) is probably the worst example as I have no idea what 'plurinational' means) and eBird and I both use simpler versions such as 'Bolivia'; and
- Political issues - I'm sure that if the UNPD figures showed Taiwan or Kosovo as separate countries the relevant Ambassadors from Other Countries would melt the bitumen on 1st Avenue NY NY going over to complain.

It would be nuts to try to present tables or graphs covering all or any of these in the presentations which follow so in each chart I will just show the top 20 entries. The simple stuff (eg countries x number of Big Day species and # of checklists submitted) are available from the eBird website so I won't bother with them.
The first analysis is the number of species recorded in the Big Day divided by the population. To get numbers that are easy to comprehend I have used population in millions. I have shown a graph, rather than numbers, as it is sufficient for the use. (NB: click on any of these graphics to see a larger version.)

The major difference arose when a filter of "submitted at least 100 Big Day sheets" was applied. This cut down the list from 131 to 20 countries!

(As an aside, while Tanzania hasn't featured too greatly in my results the 21 sheets from that country scored 320 species - somewhat over 1/3rd of those ever recorded. Given that there are few indigenous birders and the tourist industry is not at peak in May that is probably a pretty fair wazungu effort.)
As well as this information about the Big Day the eBird site can also provide information about the number of species ever reported and the number of checklists ever submitted. (This will include lists submitted by folk loading up their life lists, including lists compiled before the Internet was invented, let alone eBird.)
Here are the top 20 countries in terms of the number of species ever reported to eBird.

My next analysis is the proportion of species ever recorded which were entered in the Big Day.

I will also give particular praise to Sri Lanka as I recall from our visit to that lovely country that most of their migrant species have shot through (Australian for 'gone away' rather than implying they have been killed - this isn't Malta) by May. Possibly it reflects the small size of the country, and the fact that the expert guides know exactly where to go to bag a lot of species in a short time.
The countries which supply a lot of eBird sheets every month (USA, Canada and Australia) are also pretty well up this list.
Apart from Zimbabwe - those folk really did a good job - the Dark Continent seems to have underperformed, especially noting the appearance of several sub-Saharan countries in the top 20 list for # species ever seen. Presumably everyone in China is too busy making stuff to sell to the rest of us to go birding for the day (or they couldn't see birds through the smog).
I am sure there is lots more could be done with these data and I may have another go later.


Comments