Posts

Showing posts with the label census

The old folks at home

Image
There has been a fair bit of commentary on the Mallacoota Community Facebook page about the need for ages care facilities in this area.  Having worked, in various roles, on censuses for the last 17 years of my career I thought I'd see what the 2016 Census had to say about the persons of mature years.  (I hate the term 'seniors" and "old fogies" seems disrespectful.) The data was accessed through the excellent - and free -  Table Builder  online facility from ABS.  I have used information on a usual residence basis (so anyone unwise enough to be camping in town in August 2016 isn't included).  Perhaps more importantly, anyone using Marshmead would be excluded as they are not usually resident. Geography is quite important in such matters and I used two approaches to the matter,  I began at the Local Government level, where East Gippsland is appropriate.  I then went to the State Suburb (SSC) level looking at Mallacoota  (which includes Karb...

What keeps Mallacoota going?

Image
In electronic conversation with another frequent visitor to Mallacoota we discussed the importance of tourism, or at least visitation, to Mallacoota.  What would happen if the place ceased to attract tourists? I'm not sure I am going to be able to answer that question in detail but a look at some Census data might help.  My starting point is a table of employment by industry for the State Suburb of Mallacoota (possibly Gypsy Point and Genoa could have been added but I decided to keep things simple).    A few industries (eg Mining, Wholesale Trade) had no employment in Mallacoota.  Excluding them, the results are summarised below:  I then estimated - OK, truth in advertising, guessed - the proportion of each industry employed by tourism.  For some (Agriculture etc, Education) this was zero.  For others it was a non-zero proportion varying from 10% (Health etc services ) to 90% (Accommodation and Food).  Construction was tricky, but ...

Traps -or at least pitfalls - for old players

Image
Reader advisory:  Please note that is a tale about an error - so read the whole post before trying to emulate this!  As consequnce of my discoveries some of my earlier posts about the 2016 Census have been massaged a little to reflect my new understanding. When the first tranche of 2016 Census data was released in June 2016 I seized upon the General Profile for Carwoola with glee and did a basic comparison of people and dwellings between 2016 and 2011 Census results.  There was no drama with the people comparison, but the comparison of data from the Profile with information for 2011 Table Builder results suggested a fairly serious undercount of dwellings in 2016.  This is that comparison (its an image not a table). I developed various conspiracy theories about how this arose and in February 2018 decided to document the issues with the poor count of dwellings.  As I greatly prefer using Table Builder (TB) to wading through a squillion worksheets of profile d...

Learning from the census

Image
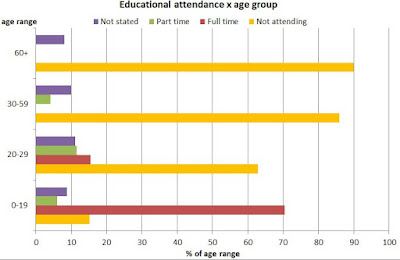
I was reviewing the topics I have covered in articles for the Gazette and found that I hadn't done anything about Education and Qualifications per se .  So here goes. The first person to learn something through this was the author who had to find out what was involved in the various Certificates etc mentioned in the Census Qualification descriptors.  The authority on this seems to be the Australian Qualifications Framework .  They become important when looking at the Highest Educational Attainment which will come a little further down this post. I will however start with the topic of attendance at an educational establishment. This chart shows that the information is very much in line with expectations. (So not much learning there, but it gives some confidence in the process that this is so!) A few points of interest arise: The not-stated rate is relatively high but:  will include all the imputed records (~7% of person records in the Gazette area); I...

A walk round East Basin

Image
Lake Burley Griffin is crossed by two bridges and is ended by Scrivener Dam.  This splits the water body into three sections known as West Basin (Scrivener to Commonwealth Avenue Bridge);  Central Basin (between Commonwealth and Kings Avenues) and East Basin (Kings Avenue to Dairy Flat) Today we walked the 10km (approximately) around East Basin.  The route, done anticlockwise, is shown in this clip from Google Earth. Although we wanted to do some birding at Jerrabomberra Wetlands it is no longer possible to park there without a risk to finding you car has been broken in to.  So we parked at the Canoe Club and schlepped our binoculars round the route. The first birds were these vermin.  I have no idea why the Parks people haven't converted them into pate or some other useful commodity.  Presumably they will only start to take notice when they have reached Myna levels of population.  After crossing Kings Avenue Bridge we got to the site of a ...

Unpaid work

Image
In the past the Census only concerned itself with traditional market based employment.  More recently it was widened its scope to include some information on other aspects of employment, notably domestic work and volunteering.  I wouldn't want people to think I'm a stick in the mud so here is a little information about those two aspects of Gazette area activity. Domestic work This includes work that the person did without pay, in their own home and in other places, for themselves, their family and other people in the household, in the week prior to Census night. I can't remember how I answered the Census question (and it was complicated by us being on a camping trip in Queensland at the time) but would be surprised if a two person household (who mainly eat at home) would put in less than 20 hours on these tasks per week.  I'm not sure how much extra time is added by additional people and expect quite a bit would be reduced by eating out (eg lunches at work).  Th...

Keeping occupied in the Gazette area

Image
The remaining major element of the workforce data from the 2016 Census is the occupation of people in the area.  While "industry" relates to the goods and services produced by an enterprise "occupation" covers the tasks performed by the individuals who work for the enterprise. I'll start this by comparing Industry and Occupation in the Gazette area.  Its a bit messy and uses abbreviated titles but I hope you can work out what's going on! Prim inds Manuf' + Utilities Const  Retail W'sale Trade Accom Food Transp + media Finan servs Public Admin Educn  Health Care  Arts etc  Inad and N/S Man'rs 21 10 16 24 5 8 22 69 0 12 10 10 Prof''als 0 5 3 0 0 6 37 68 48 35 7 6 Trades 6 19 65 8 6 7 8 6 0 3 15 6 Services 0 0 0 0 10 0 0 20 ...

The Gazette (area) industry

Image
Having looked at the number of workers in the Gazette area and how/where they go to to work this post looks at the outcome of their labours.  That means the nature of the goods and services delivered by their employers. The ABS classification of industries has 19 entries at the top level.  Several of these have very low numbers of employees in the Gazette area and it is very difficult to fit, in a legible way, such a large group of entries in a blog-chart.  In addition the confidentiality algorithm of the ABS makes small numbers unreliable (as might the impact of non-response and imprecise reporting by punters).  So I have combined the groups in a hopefully logical way to give a set of 11 slightly broader groups. I have also adopted relatively brief names for the groups to present the charts in a sensible way. I may do a later post looking at the major components of the more significant groups if that looks interesting My first analysis is the number of person...

How d'ya get there?

Image
As well as details of whether people work or not the Census collects details of where people work and how they travel to work.  This is mainly used by planners etc in the big cities to work out public transport schedules and some aspects of road planning. Before getting to the local results I was always interested in the relationship between size of a City and use of cars for the commute. The actual data available from the ABS is amazingly detailed with some 230 combinations of modes available.  There are of course some 'special'modes such as ferries in Sydney (0.36% of commutes) and trams in Melbourne (2.71%) and Adelaide (0.53%). There are no ferries on the Molonglo and trams , trains and even buses are few on Captains Flat Road.  So the commute in this area is dominated by the car. I assume that most of those who walked to work were folk employed on properties, as would be some of those who worked at home.  (In view of the rural nature of the area I'm a ...

High level work

Image
This is the first part of my examination of 2016 Census data on employment for the catchment area of the Stoney Creek Gazette (which to save typing I will call the Gazette area).  There are quite a few posts on this blog already on the Census, so look at the tag Census in the list to the right. Participation in the Labour force The broadest topic about work covered in the Census is whether someone is in the Labour Force or not.  This question is, by international convention, limited to people aged 15 years or more: those under that age comprise the 'not applicable' category.  'Not stated' is largely self-explanatory although it could be noted it includes situations where person details were imputed due to a form not being received for an apparently occupied house.  The people in the Labour Force are subdivided into 5 categories and those respondents aged 15+ who aren't in one of those are Not in the Labour Force.  The Gazette area had a higher proportion o...