Whither weather?
For most of this year - certainly since March 2011 - it has appeared to me that the weather forecasts for Canberra issued by the Bureau of Meteorology (BoM) have been a bit of a dogs breakfast. By that I mean they have been all over the place. I place great weight on the phrase "appeared to me" since I have not tried to record events in any structured sort of way.
By way of example, here is a summary of my memory of the weather forecast issued prior to 31 July for the period from Sunday 31 July to about Friday 5 August.
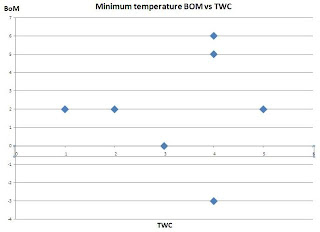
Of course, the BoM forecasts, while the most authoritative are only one of the forecasts issued. I also look at the forecasts issued by The Weather Channel (TWC). For the first 7 days of August there is not great correlation in the minimum temperatures (see comments on this graph):
 Another way of looking at this is to do a line graph of the two series:
 The following chart shows the variability of forecast rainfall for 3 dates. Notes about interpreting the graph follow the image.
 Looking at the forecast for 8 August (red columns) the BoM started forecasting on 1 August, with no precipitation expected. For the next two days the forecast for 8 August was 'chance of showers' which rose to 'rain' in the forecast of 4 August dropping back to 'chance of showers' from the forecast on the 5th.
In essence this shows the problem: no, or very little rain forecast then downpour then drop back to very little.
WRT to rainfall the agreement between the two forecasts is better in that they are identical except for 7 August where TWC indicate chance of showers.
Adding to the confusion is a disconnect between what is on the BoM website and what is announced on the ABC TV News. For the first period of observations (1 August) the website said -1.8 was the minimum while the presenter on TV said -3. I will stick with what is on the website, since if it is on the internet it must be true!
By way of example, here is a summary of my memory of the weather forecast issued prior to 31 July for the period from Sunday 31 July to about Friday 5 August.
- There were to be no frosts in this period (ie all minimum temperatures would be above 0);
- There would be showers on Sunday and then showers again from Wednesday through Friday.
- A mininmum of -3 for Monday and 0 for Tuesday.;
- Isolated showers on Friday.
- the overnight minimum forecast for each day; and
- an indicator of likely rainfall.
Of course, the BoM forecasts, while the most authoritative are only one of the forecasts issued. I also look at the forecasts issued by The Weather Channel (TWC). For the first 7 days of August there is not great correlation in the minimum temperatures (see comments on this graph):


In essence this shows the problem: no, or very little rain forecast then downpour then drop back to very little.
WRT to rainfall the agreement between the two forecasts is better in that they are identical except for 7 August where TWC indicate chance of showers.
Adding to the confusion is a disconnect between what is on the BoM website and what is announced on the ABC TV News. For the first period of observations (1 August) the website said -1.8 was the minimum while the presenter on TV said -3. I will stick with what is on the website, since if it is on the internet it must be true!


Comments
I was looking for two separate lots of TWC and BOM dots.
Am I missing something?
Denis
The dots in the graph relate the value of BoM to the value in TWC. Thus the lowest dot is for -3 on the BoM scale (vertical axis). For the same day TWC were forecasting +4 (so the dot is a fair way out on the horizontal axis).
I will add a chart with two lines (assuming I have kept the TWC data).
Martin